Visualization#
Learning goals
After finishing this chapter, you should be able to
make simple plots
plot several functions in one figure either in one or multiple axes
add a title, labels, a legend, describe the axes, change the range of axes
make histograms
save images
make scatter plots
save figures to files
In the previous chapters, you have learned to manipulate data and write simple functions and classes. This chapter focuses on ways to visualize your data. Data can be NumPy arrays, lists, vectors, matrices, images.
Matplotlib#
The simplest visualization that you can do in Python is to plot data. For this, you first need to import the appropriate packages. By far most plotting and visualization in Python is done using the Matplotlib package. Matplotlib is a package that contains the pyplot module, which in turn contains a collection of objects and functions that allow you to easily create and manipulate figures. One useful feature of pyplot is that it keeps track of the current figure and axis.
Matplotlib is pre-installed with your Anaconda distribution, so there’s no need to install it. However, interactive plots in Matplotlib require a suitable backend. For this, you will have to install one additional package. Go to your Anaconda prompt (in Windows) or your terminal (in MacOS) and type
conda install ipympl
This will install an additional package in your Anaconda installation that lets you make interactive plots.
Line plots#
The easiest plot is that of a line. We can start by importing the pyplot functions of Matplotlib. The pyplot module is typically imported as plt. Then we use the plot function of pyplot to plot \(x\)-values and \(y\)-values. In general, Matplotlib expects that you want to plot Numpy arrays, or objects that can be converted to Numpy arrays by calling the numpy.asarray() function. We here create an arange of \(x\)-values, and some random \(y\)-values to plot. Note that the number of \(y\)-values should be the same as the number of \(x\)-values.
import numpy as np                # Import NumPy
import matplotlib.pyplot as plt   # Import the matplotlib.pyplot module as plt

# A magic command that tells matplotlib to make interactive figures, uses ipympl
# %matplotlib widget

x = np.arange(10)                 # Create an array of x-values
y = np.sort(np.random.randint(0, 100, 10))  # Create some y-values

fig, ax = plt.subplots()     # Creates a Figure object with a single Axes object
ax.plot(x, y);               # Plot y as a function of x on the Axes object
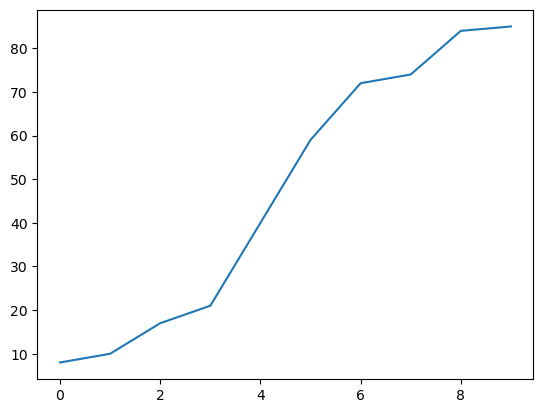
The plot that you have just made is interactive: you can drag it, zoom it, save it. Take a look at this website to learn what you can do with the tools that appear as you move your mouse over the image. You can also make the image larger and smaller by pulling the little triangle on the bottom right.
In the previous chapter, you’ve learned about classes and objects. Like all of Python, Matplotlib is built out of objects. The below figure from the Matplotlib website nicely visualizes the difference between a Figure and an Axes object, and what kinds of properties the Axes object has. As you can see, the Figure is the background panel on which the Axes is drawn. A Figure can have multiple Axes objects. The Axes object has labels on the \(x\) and \(y\) axes, a title, ticks, a legend, etc.

We can use the methods of the Axes object to add labels and titles to our figure. In the example below, we set a label for the \(x\)-axis, a label for the \(y\)-axis, and a title for the plot.
fig, ax = plt.subplots()        # Creates a Figure object with a single Axes object
ax.plot(x, y)                   # Plot y as a function of x on the Axes object
ax.set_xlabel('x')              # Set a label for the x-axis
ax.set_ylabel('y')              # Set a label for the y-axis
ax.set_title('My first plot');  # Set a title
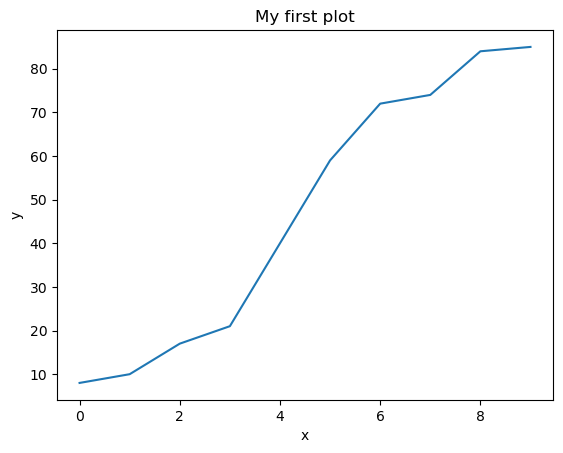
In this case, we have provided an \(x\)-array and a \(y\)-array. However, we can also provide only a \(y\)-array. In that case, Matplotlib assumes that the spacing between all points is the same.
Documentation
The Axes object has many attributes and methods that are not shown in this figure. You can find the full documentation here.
Exercise 8.1
Plot the function \(y=\sin(x)\) between \(x=-\pi\) and \(x=\pi\).
Hint Use np.sin
Opdracht 8.1
Plot de functie \(y=\sin(x)\) tussen \(x=-\pi\) en \(x=\pi\).
Hint Gebruik np.sin
Styling your plots#
Matplotlib has standard ways to style a plot. For example, if you plot a single line, it will always be blue. However, you might want to change the appearance of your figure. In the plot of the line that we just made, we can easily change the color by providing the color argument to the function. We can also change the width of the line by providing the linewidth argument, and the style of the line using the linestyle argument. For example, we can plot a dashed line using linestyle='--'. These are all optional arguments, and you can personalize your figures quite nicely by providing your own parameter values. You can find an overview of linestyles here.
fig, ax = plt.subplots()     # Creates a Figure object with a single Axes object
ax.plot(x, y, color='red', linewidth=3, linestyle='--')                # Plot y as a function of x on the Axes object

ax.set_xlabel('x')
ax.set_ylabel('y')
ax.set_title('My first plot');
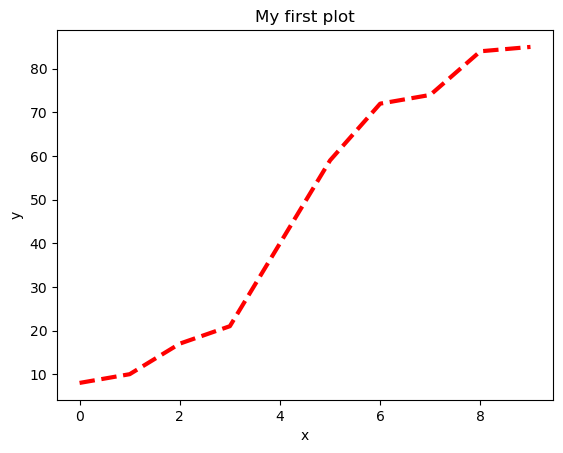
We have here used the named color red to indicate that we want to make a red (dashed) line. There is a whole range of named colors that you can use in Matplotlib, see the overview below.
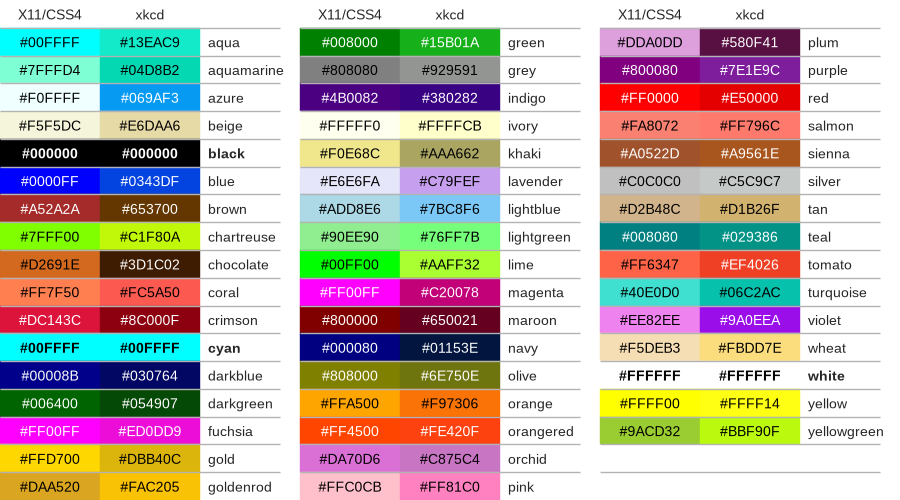
If your favorite color is not in this overview, you can also define your own color in red, green and blue (RGB). For example, the piece of Python code below defines the color red using RGB as (1, 0, 0) and gives exactly the same result as the code above. The Matplotlib website contains a lot of information about the diferent ways in which you can set colors.
fig, ax = plt.subplots()     # Creates a Figure object with a single Axes object
ax.plot(x, y, color=(1, 0, 0), linewidth=3, linestyle='--')     # Note that we've here changed the way that we represent color

ax.set_xlabel('x')
ax.set_ylabel('y')
ax.set_title('My first plot');

Exercise 8.2
Download this file that contains an ECG signal and load its contents into a NumPy array. Plot it with a fitting style. Try out different colors and line widths. Add a title and label.
Opdracht 8.2
Download dit bestand dat een ECG signaal bevat en laad de inhoud in een NumPy array. Plot de data met een passende stijl, probeer verschillende kleuren en line widths en voeg een titel toe. Voeg labels aan de assen toe.
Multiple plots#
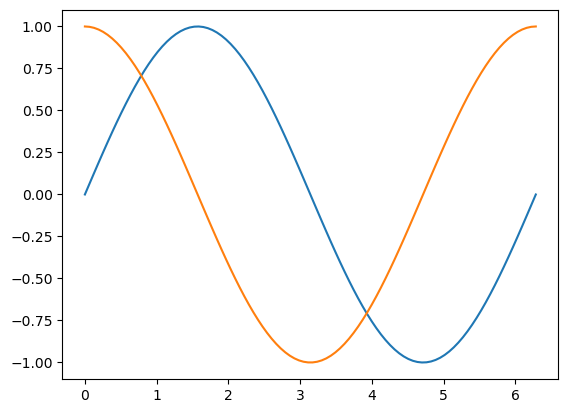
One Axes object can show multiple plots. For example, we can use one Axes object to plot both the sine and cosine of \(x\) using the code below. Note that we just do this by repeatedly calling the plot method on the Axes object. Each time we do this, an extra plot is added. Also, note that a different color is automatically selected for each line that we add. Of course, here you can also choose your own style.
import numpy as np

x = np.linspace(0, 2*np.pi, 100)      # Make a Numpy array with 100 evenly spaced values between 0 and 2pi
fig, ax = plt.subplots()
ax.plot(x, np.sin(x))
ax.plot(x, np.cos(x));
Labels and legends#
When plotting multiple lines in one Axes object, it’s easy to lose track of which line corresponds to which data set or function. We can use the label parameter in plot to assign a label to each line, and the legend method of Axes to show a legend of labels.
x = np.linspace(0, 2*np.pi, 100)
fig, ax = plt.subplots()
ax.plot(x, np.sin(x), label='$sin(x)$')
ax.plot(x, np.cos(x), label='$cos(x)$')
ax.legend();
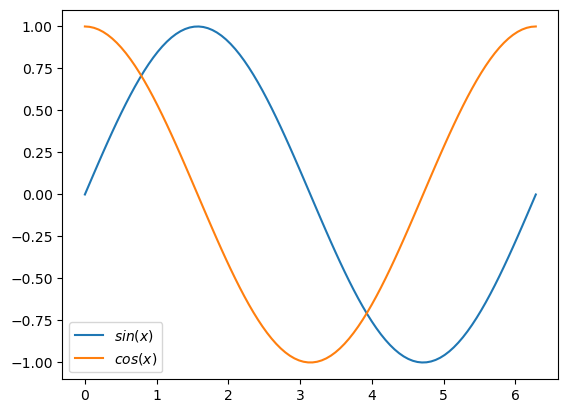
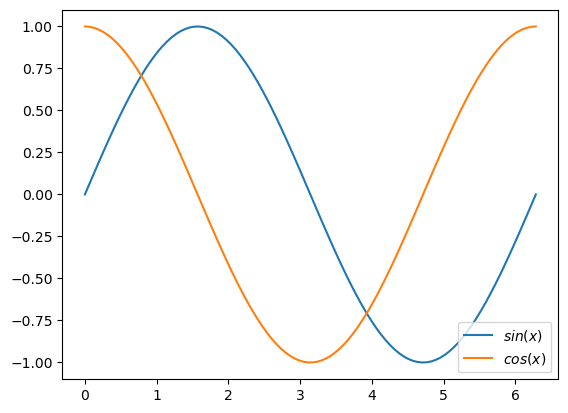
The legend function can also be called with a loc argument, which defines where the legend should be placed. Options are ‘best’ (default, Matplotlib will automatically look for the location where most space is available), ‘upper right’, ‘upper left’, ‘lower left’, ‘lower right’, ‘right’, ‘center left’, ‘center right’, ‘lower center’ ,’upper center’, ‘center’.
Exercise 8.3
Use Matplotlib to replicate the figure below.
Opdracht 8.3
Maak onderstaande figuur na in Matplotlib op basis van wat je tot nu toe hebt geleerd.
x = np.linspace(0, 2*np.pi, 100)
fig, ax = plt.subplots()
ax.plot(x, np.sin(x), label='$sin(x)$')
ax.plot(x, np.cos(x), label='$cos(x)$')
ax.legend(loc='lower right');
Instead of providing labels when plotting individual lines, legend can also be called with a list of labels, which should have the same length as the number of lines.
x = np.linspace(0, 2*np.pi, 100)
fig, ax = plt.subplots()
ax.plot(x, np.sin(x))
ax.plot(x, np.cos(x))
ax.legend(labels=['$sin(x)$', '$cos(x)$']);

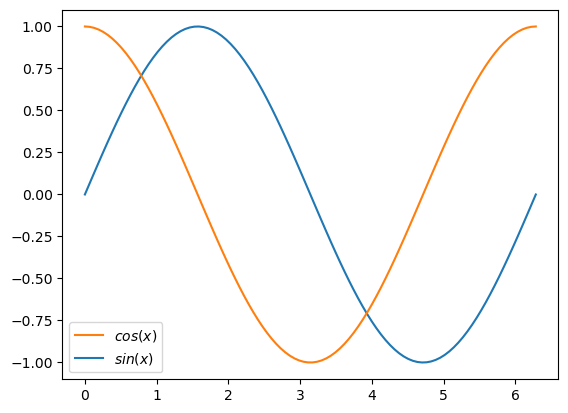
For full flexibility, the legend function also allows you to define which lines you want to show in your legend, and in which order. This is done using the handles parameter. For this, we should make sure to get a handle to the lines that we’re plotting. The plot function has an optional return argument that we now catch. Now, we can easily swap the order of the lines in the legend.
x = np.linspace(0, 2*np.pi, 100)
fig, ax = plt.subplots()
sin_line, = ax.plot(x, np.sin(x))
cos_line, = ax.plot(x, np.cos(x))
ax.legend(handles=[cos_line, sin_line], labels=['$cos(x)$', '$sin(x)$']);
Subfigures#
Of course, we don’t always want to show all data in a single figure. Sometimes, you might want to combine multiple plots in one figure. You can use almost the same syntax as before, but now we ask pyplot to make two Axes objects which are stored in a NumPy array named axs. We can operate on the individual Axes objects by indexing this array. Then, we can do anything that we have done before for individual Axes objects. This is a very powerful way to make figures.
import numpy as np

x = np.linspace(0, 2*np.pi, 100)           # Make a Numpy array with 100 evenly spaced values between 0 and 2pi

fig, axs = plt.subplots(1, 2)              # Make a Figure object with Axes organized in one row and two columns
axs[0].plot(x, np.sin(x), color='blue')    # Plot the sine of x on the first Axes object
axs[0].set_title('$sin(x)$')               # Set a title for the first subplot, note that we can do this in LaTeX
axs[1].plot(x, np.cos(x), color='orchid'); # Plot the cosine of x on the second Axes object
axs[1].set_title('$cos(x)$');               # Set a title for the second subplot
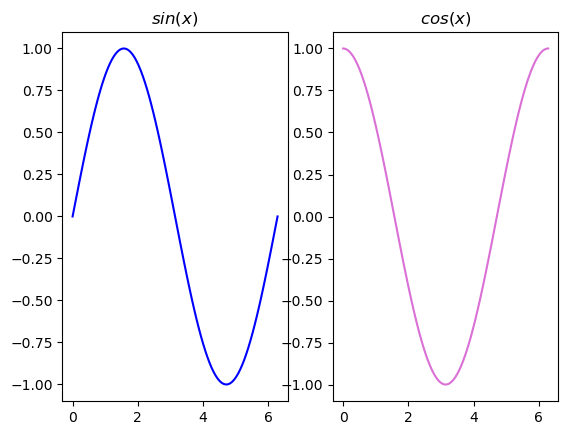
The inputs to the subplots function define the organization of our subfigures. In the example above, we have made a Figure with one row and two columns of Axes objects. Alternatively, we can make more complex layouts using the subplot_mosaic function in pyplot. Here, we name the Axes objects and refer to them by name. To achieve this, the subplot_mosaic function does not store the Axes objects in a NumPy array, but in a dictionary. To replicate the figure that we just made, we can use the subplot_mosaic function as follows.
fig, axs = plt.subplot_mosaic([['left', 'right']])  # Make a Figure object with two Axes objects: left and right
axs['left'].plot(x, np.sin(x), color='blue')        # Plot the sine of x on the left Axes object
axs['left'].set_title('$sin(x)$')                   # Set a title for the first subplot, note that we can do this in LaTeX
axs['right'].plot(x, np.cos(x), color='orchid');    # Plot the cosine of x on the right Axes object
axs['right'].set_title('$cos(x)$');                 # Set a title for the second subplot

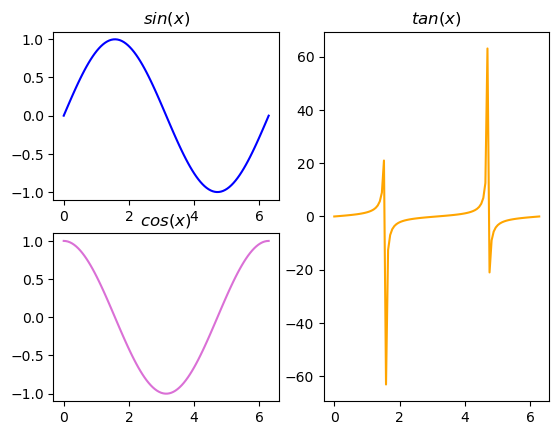
The subplot_mosaic function really shines in cases where you don’t have a regular grid of subfigures. For example, we can make a Figure with two small Axes objects on the left side and one large Axes object on the right side, as follows.
fig, axs = plt.subplot_mosaic([['left_top', 'right'],
                               ['left_bottom', 'right']])
axs['left_top'].plot(x, np.sin(x), color='blue')
axs['left_top'].set_title('$sin(x)$')
axs['left_bottom'].plot(x, np.cos(x), color='orchid');
axs['left_bottom'].set_title('$cos(x)$');
axs['right'].plot(x, np.tan(x), color='orange');
axs['right'].set_title('$tan(x)$');
Exercise 8.4
Adapt the previous figure so that it includes a second \(tan\) function, two column wide and one row high, below the current figure.
Your figure should look like this:
Opdracht 8.4
Voeg aan bovenstaand figuur nog een plot van de \(tan\) functie toe, twee kolommen breed en één rij hoog, onder het huidige figuur.
Je figuur zou er zo uit moeten zien:
Scatter plot#
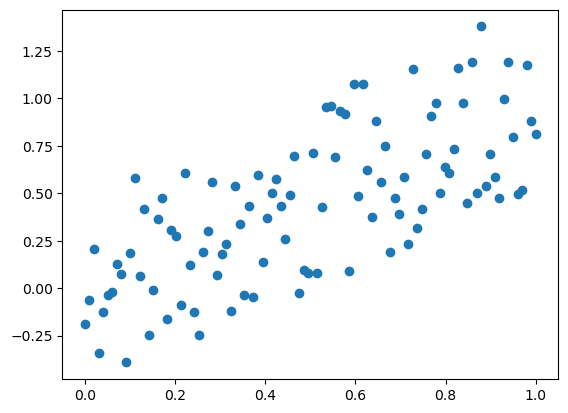
Aside from the lines that we have drawn so far, Axes objects can also handle scatter plots. Scatter plots consist of individual points that have an \(x\) and a \(y\) coordinate. Everything that we have discussed so far applies to scatter plots, the only difference is that we use the scatter method instead of plot. For example, a scatter plot of some (random) data can be made as follows.
x = np.linspace(0, 1, 100)
y = x + np.random.uniform(-0.5, 0.5, 100)

fig, ax = plt.subplots()
ax.scatter(x, y);
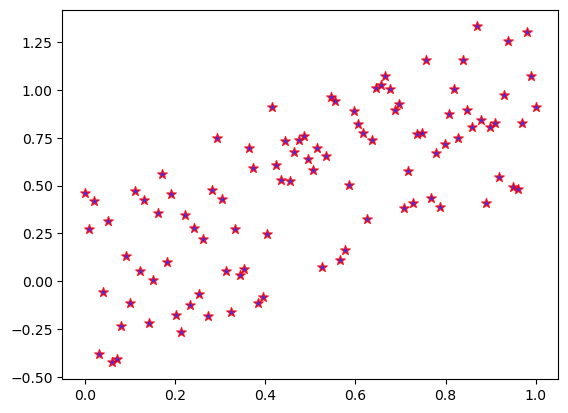
Just like lines, scatter plots can be styled, in this case using the parameters of the scatter function. Marker shapes can be changed using the marker parameter, opacity using the alpha parameter, color using the colors and edgecolors and size using the s parameters. The following table provides an overview of all available marker styles.
character |
description |
|---|---|
‘-’ |
solid line style |
‘–’ |
dashed line style |
‘-.’ |
dash-dot line style |
‘:’ |
dotted line style |
‘.’ |
point marker |
‘,’ |
pixel marker |
‘o’ |
circle marker |
‘v’ |
triangle_down marker |
‘^’ |
triangle_up marker |
‘<’ |
triangle_left marker |
‘>’ |
triangle_right marker |
‘1’ |
tri_down marker |
‘2’ |
tri_up marker |
‘3’ |
tri_left marker |
‘4’ |
tri_right marker |
‘s’ |
square marker |
‘p’ |
pentagon marker |
‘*’ |
star marker |
‘h’ |
hexagon1 marker |
‘H’ |
hexagon2 marker |
‘+’ |
plus marker |
‘x’ |
x marker |
‘D’ |
diamond marker |
‘d’ |
thin_diamond marker |
‘|’ |
vline marker |
‘_’ |
hline marker |
x = np.linspace(0, 1, 100)
y = x + np.random.uniform(-0.5, 0.5, 100)

fig, ax = plt.subplots()
ax.scatter(x, y, marker='*', alpha=0.8, c='blue', edgecolors='red', s=50);
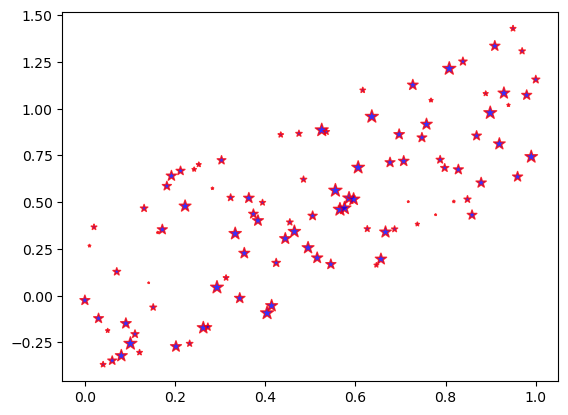
Note that not all markers need to have the same color or size. If - for example - we want to let the marker size correspond to some property of the data point, we can also use an array-like object to define the size of the markers.
x = np.linspace(0, 1, 100)
y = x + np.random.uniform(-0.5, 0.5, 100)
s = np.random.random(100)*100

fig, ax = plt.subplots()
ax.scatter(x, y, marker='*', alpha=0.8, c='blue', edgecolors='red', s=s);
x = np.linspace(0, 1, 100)
y = x + np.random.uniform(-0.5, 0.5, 100)
s = np.random.uniform(0, 100, 100)             # Random sizes between 0 and 100
c = np.random.uniform(size=(100, 3))

fig, ax = plt.subplots()
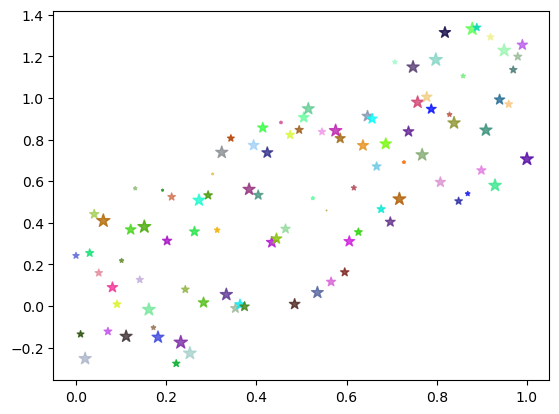
ax.scatter(x, y, marker='*', alpha=0.8, c=c, s=s);
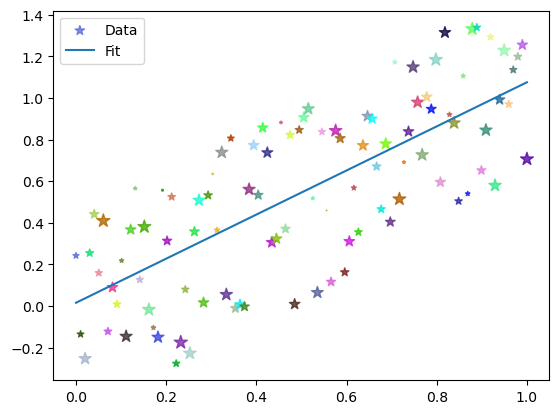
It’s important to realize that a single Axes object can show line plots as well as scatter plots. For example, we can plot the best linear fit in the scatter plot that we just made.
fig, ax = plt.subplots()
ax.scatter(x, y, marker='*', alpha=0.8, c=c, s=s, label='Data')
ax.plot(x, np.poly1d(np.polyfit(x, y, 1))(x), label='Fit')       # We use NumPy's poly1d function to find the best fit
ax.legend();
Exercise 8.5
Download the iris_data.npz file from here. This is a famous dataset consisting of 50 samples each from three species of flowers.
The file contains two NumPy arrays: data and target.
data contains four columns corresponding to:
sepal length
sepal width
petal length
petal width
target contains the label of each sample:
Iris setosa
Iris virginica
Iris versicolor
Make a scatter plot with sepal length on the \(x\)-axis and petal width on the \(y\)-axis. The plot should show all 150 flowers, with iris setosa in blue, iris virginica in red, and iris versicolor in green. Add labels, a legend, and a title.

Opdracht 8.5
Download de iris_data.npz file van here. Dit is een beroemde dataset die bestaat uit data voor 150 bloemen met drie verschillende soorten (dus vijftig bloemen per soort).
Het bestand bevat twee NumPy array: data en target.
data bevat 4 kolommen met voor elke sample:
sepal length
sepal width
petal length
petal width
target bevat de label van elk van de 150 bloemen. Mogelijke waarden zijn:
Iris setosa
Iris virginica
Iris versicolor
Maak een scatter plot van alle bloemen met ‘sepal length’ op de \(x\)-axis and ‘petal width’ op de \(y\)-axis. De drie soorten bloemen moeten elk een andere kleur krijgen in de scatter plot: iris setosa in blauw, iris virginica in rood, and iris versicolor in groen. Voeg labels, een legenda en een titel toe.
Setting axes limits#
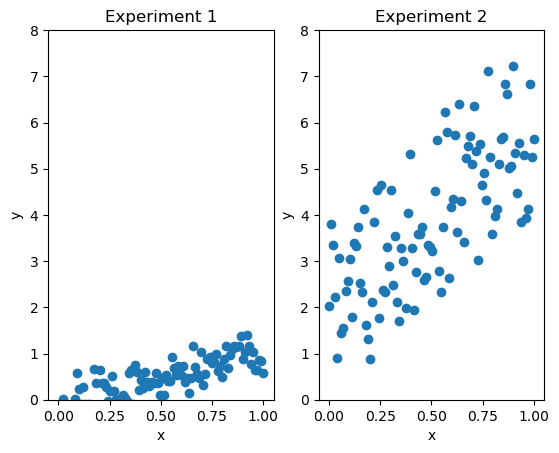
Matplotlib automatically sets the limits of the axes depending on the data, but sometimes we might want to have a bit more control over this. For example, when making multiple subfigures to compare measurements, it’s always good to use the same range for values on the \(x\) and \(y\) axis in all plots. For example, in the code below, we make two scatter plots. At first glance, the results look very similar, both plots seem to show the same correlation between \(x\) and \(y\). However, if you look at the \(y\)-axis, you can see that the values are quite different. To visualize this difference, we should set the limits of the \(y\)-axis to be the same in both subplots.
x_one = np.linspace(0, 1, 100)
y_one = x_one + np.random.uniform(-0.5, 0.5, 100)

x_two = np.linspace(0, 1, 100)
y_two = x_two*4 + np.random.uniform(-2, 2, 100)+2

fig, axs = plt.subplots(1, 2)
axs[0].scatter(x_one, y_one)
axs[0].set_title('Experiment 1')
axs[0].set_xlabel('x')
axs[0].set_ylabel('y')
axs[1].scatter(x_two, y_two)
axs[1].set_title('Experiment 2')
axs[1].set_xlabel('x')
axs[1].set_ylabel('y');
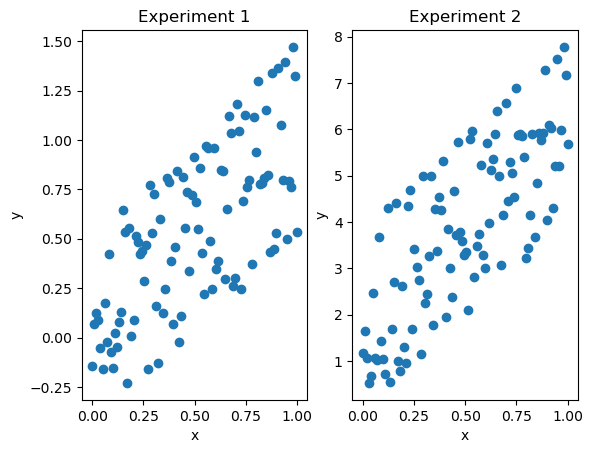
The limits of an axis can be set using the set_xlim and set_ylim methods of the Axes object. In this case, we only need to change the \(y\)-limits, so we do the following, and we suddenly clearly see the difference between the data in our two imaginary experiments.
x_one = np.linspace(0, 1, 100)
y_one = x_one + np.random.uniform(-0.5, 0.5, 100)

x_two = np.linspace(0, 1, 100)
y_two = x_two*4 + np.random.uniform(-2, 2, 100)+2

fig, axs = plt.subplots(1, 2)
axs[0].scatter(x_one, y_one)
axs[0].set_title('Experiment 1')
axs[0].set_xlabel('x')
axs[0].set_ylabel('y')
axs[0].set_ylim(0, 8)
axs[1].scatter(x_two, y_two)
axs[1].set_title('Experiment 2')
axs[1].set_xlabel('x')
axs[1].set_ylabel('y');
axs[1].set_ylim(0, 8);
Histograms#
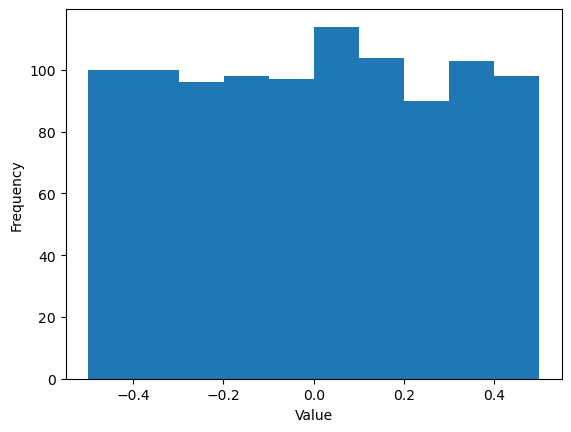
A third way to visualize data is using histograms. A histogram consists of bins that contain the frequency of some value occuring. In Chapter 6, you have already seen a histogram for the numbers generated by a random number generator. In the example below, we sample 1000 random numbers and then make a histogram using the hist method.
y = np.random.uniform(-0.5, 0.5, 1000)

fig, ax = plt.subplots()
ax.hist(y);
ax.set_xlabel('Value')
ax.set_ylabel('Frequency')
Text(0, 0.5, 'Frequency')
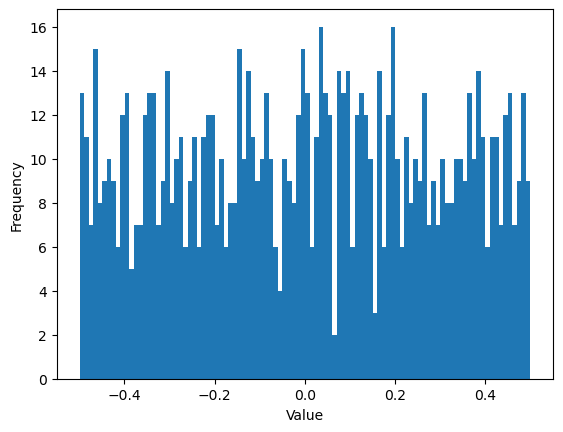
We can also set the number of bins in a histogram as follows:
fig, ax = plt.subplots()
ax.hist(y, bins=100);
ax.set_xlabel('Value')
ax.set_ylabel('Frequency')
Text(0, 0.5, 'Frequency')
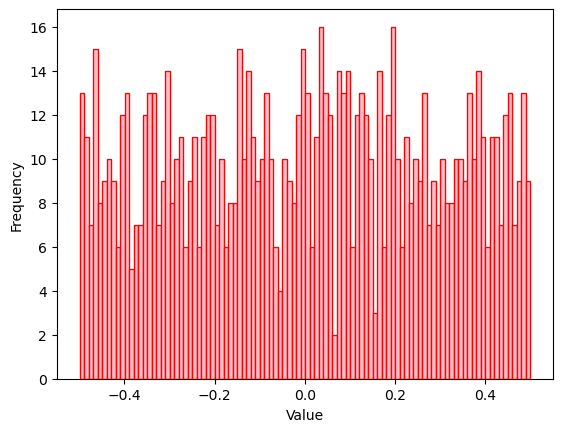
And as with anything in Matplotlib, we can add additional options, for example to make our bars stand out better.
fig, ax = plt.subplots()
ax.hist(y, bins=100, color='pink', edgecolor='red');
ax.set_xlabel('Value')
ax.set_ylabel('Frequency')
Text(0, 0.5, 'Frequency')
Exercise 8.6
Make a histogram for the final grades of students in the grades.npy file that you used in Chapter 6.
Opdracht 8.6
Maak een histogram voor de eindcijfers van studenten uit het grades.npy bestand dat je in Hoofdstuk 6 gebruikt hebt.
Plotting in 3D#
Sometimes, we want to visualize 3D data, such as points in 3D, where we have \(x\), \(y\), and \(z\) coordinates. For this, we first need to import mplot3D. Then, the process is much the same as before. The only thing is that we need to let the Axes object know that we want a 3D view, and we should use dedicated plot3D and scatter3D functions. In the subplots function that we have used so far, we cannot indicate that we need a 3D view. Therefore, take a slightly different approach, in which we first make a Figure object, and then add a 3D Axes object to it.
from mpl_toolkits import mplot3d

fig = plt.figure()
ax = fig.add_subplot(projection='3d')

# Data for a three-dimensional line
zline = np.linspace(0, 15, 1000)
xline = np.sin(zline)
yline = np.cos(zline)
ax.plot3D(xline, yline, zline, 'gray')

# Data for three-dimensional scattered points
zdata = 15 * np.random.random(100)
xdata = np.sin(zdata) + 0.1 * np.random.randn(100)
ydata = np.cos(zdata) + 0.1 * np.random.randn(100)
ax.scatter3D(xdata, ydata, zdata);

ax.set_xlabel('x')
ax.set_ylabel('y')
ax.set_zlabel('z');
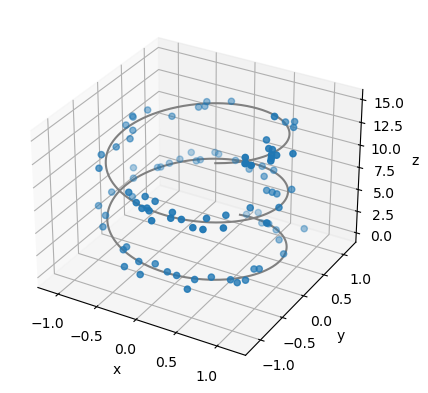
There are many things you can do with 3D plotting in Matplotlib. Take a look at the gallery to see some examples.
Exercise 8.7
Download the file carotid.npz from here. This is an npz file that contains two arrays: left and right. Each array has size \(n\times 3\) and the columns correspond to the \(x\), \(y\), and \(z\) axis. Make one 3D axis that shows both scatter plots for both carotid arteries. Add a legend and title to your figure.
Hint Because there are many points in each data set, your carotids will be better visualized if you use a very small marker size, e.g., 0.05.
Opdracht 8.7
Download het bestand carotid.npz hier. Dit is een npzbestand dat twee arrays bevat: left (voor de linker carotide) en right (voor de rechtercarotide). Elke array heeft een grootte van \(n\times 3\) waarden, waarbij de kolommen corresponderen met de \(x\), \(y\), en \(z\) as. Elke rij is dus een punt in 3D. Maak een 3D plot die beide arrays laat zien. Voeg een legenda en een titel toe aan het figuur.
Hint Aangezien de dataset veel punten bevat, zullen de halsslagaders beter van elkaar te onderscheiden zijn als je een kleine marker size (bv. 0.05) gebruikt.
Showing images#
Line and scatter plots are not the only things we can visualize in an Axes object, we can also show images using the imshow function. A basic example is given below. Note how we again have an Axes object on a Figure object. The Axes object has an \(x\)-axis and a \(y\)-axis.
Upside down
Take a close look at the \(y\)-axis. As you can see, \(y=0\) is now at the top and \(y=511\) is at the bottom. This is the opposite of what we’re used to when plotting lines or scatter plots, where the axis runs from bottom to top instead of top to bottom.
from skimage import data

astronaut = data.astronaut()   # This loads a (512, 512, 3) RGB image of an astronaut from scikit-image package
fig, ax = plt.subplots()       # This is just the same as before
ax.imshow(astronaut);          # Also same as before, but now we use imshow instead of plot or scatter

This is an RGB figure where each pixel (image dot) has three values. There are 512 x 512 pixels in this image. In many cases, you’ll have only one value or channel per pixel. For example, when working with MRI or CT images. In the example below, we convert the astronaut image from RGB to grayscale, i.e., we now only have one value per pixel. If we show this image using imshow, it’s not visualized as a grayscale image but in green/yellow/blueish colors, see below.
from skimage import color

astronaut_g = color.rgb2gray(astronaut)   # Make a grayscale verison of the RGB image

fig, ax = plt.subplots()         # This is just the same as before
ax.imshow(astronaut_g);          # Also same as before, but now we use imshow instead of plot or scatter

This is the default colormap that Matplotlib uses, called ‘viridis’. A lot of science goes into making these colormaps: a good colormap should allow the user to distinguish subtle differences in image values. However, in this case, we just want to show the image in grayscale. Luckily, Matplotlib allows you to select your own colormap using the cmap parameter of the imshow function. A full list of possible colormaps can be found here. For the current image, we select the gray colormap.
fig, ax = plt.subplots()               # This is just the same as before
ax.imshow(astronaut_g, cmap='gray');   # Also same as before, but now we use imshow instead of plot or scatter

Even though we’re now showing an image on our Axes object, it’s still just an Axes object, which means that we can change the labels, title, legend, etc. One useful method for images is to remove the \(x\)-axis and \(y\)-axis using the set_axis_off method.
fig, ax = plt.subplots()               # This is just the same as before
ax.imshow(astronaut_g, cmap='gray');   # Also same as before, but now we use imshow instead of plot or scatter
ax.set_title('An astronaut')
ax.set_axis_off()

Exercise 8.8
The function below creates a flag. Use this function to create a flag. Then show this flag in Matplotlib using the imshow function. For this, you should choose an appropriate cmap (from here) so that it becomes the Dutch national flag.
def get_flag():
    flag = np.zeros((300, 450))
    flag[:100, :] = 1
    flag[100:200, :] = 0
    flag[200:300, :] = -1
    return flag
Opdracht 8.8
De functie hieronder geeft een ‘vlag’ terug met drie verschillende balken. Gebruik deze functie om een afbeelding te tonen van de Nederlandse vlag met imshow. Kies hiervoor een geschikte colormap (cmap) van dit overzicht.
def get_flag():
    flag = np.zeros((300, 450))
    flag[:100, :] = 1
    flag[100:200, :] = 0
    flag[200:300, :] = -1
    return flag
Saving your figures#
Once you’ve made some beautiful figures in Matplotlib, you might want to save them to use them in a report or presentation. This can be done using the savefig function in pyplot. This function saves the current Figure object that you’re working on. The dpi parameter stands for ‘dots per inch’. The higher you set this number, the better your image quality and the larger your file.
fig, ax = plt.subplots()               # This is just the same as before
ax.imshow(astronaut_g, cmap='gray');   # Also same as before, but now we use imshow instead of plot or scatter
ax.set_title('An astronaut')
ax.set_axis_off()
plt.savefig('astronaut.png', dpi=300);
Explicit vs. implicit pyplot#
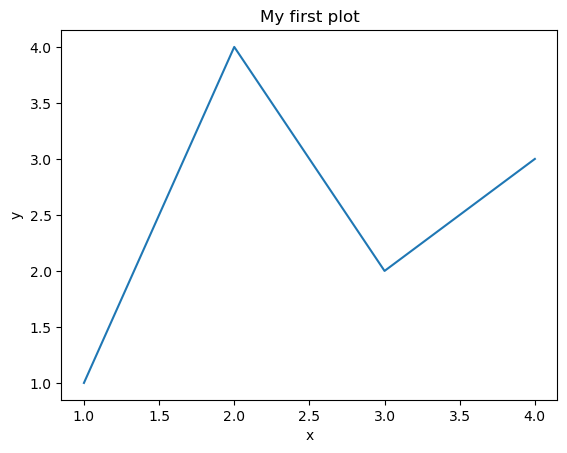
So far, we have explicitly defined our Figure and Axes objects, plotted directly on the Axes and adjusted labels and titles on the Axes objects. To make live a bit easier, pyplot also provided an implicit style. Instead of calling the methods of the Axes object, you then use functions in pyplot, and Matplotlib will automatically operate on the correct Axes object. For example, instead of doing ax.plot() or ax.imshow(), you can use plt.plot() or plt.imshow(). In many cases, we only want to make a figure with a single Axes object. In those cases, the code below would also suffice to give us exactly the same figure. Note that in the code snippet below, we never explicitly refer to an Axes object.
Rule of thumb
In general, you’re advised to use the explicit style where you define Axes objects and operate directly on those. However, if you’re just plotting a single figure, it might be convenient to use the implicit style as below.
x = [1, 2, 3, 4]
y = [1, 4, 2, 3]

plt.figure()     # Creates a Matplotlib Figure
plt.plot(x, y)   # Plot some data on the (implicit) Axes of that Figure
plt.xlabel('x')
plt.ylabel('y')
plt.title('My first plot')
Text(0.5, 1.0, 'My first plot')
import matplotlib.pyplot as plt

plt.plot([1, 2, 3, 4])
plt.show()
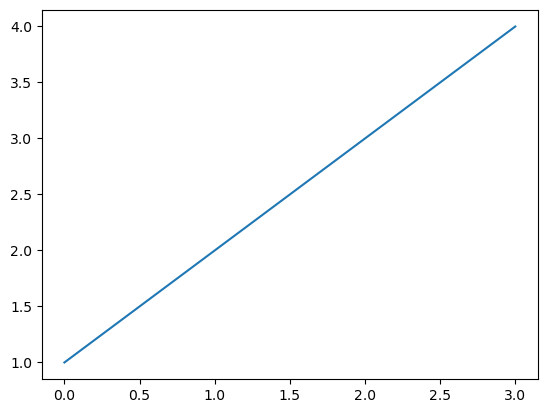
You can do the same for plot, scatter, imshow.


